Visualization
Ooooh, my first visualization application!
For the course Visualization I write a fluids flow visualization. Based on some sample code and a simulation, this little beast already miaows a bit. We had smoke and hedgehogs, two fairly standard techniques in visualization. It shows you the density and direction of the flow of a fluid (or gas if you like) when you inject some fluid in it (using your mouse in this simulation).
By the way, the whole thing is animated of course.
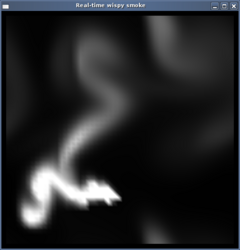
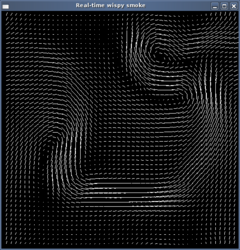
The two standard visualizations
Now I added streamlines, another technique. Currently it uses Euler’s numerical integration, which is fairly inaccurate for this application. I think I’ll have to change it before I hand it in.
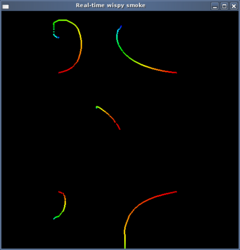
The newly added visualization
There is this little problem with streamlines; you don’t know in advance where they will end up. Thus you’ll never know whether you cover an area well enough to be able to say something about it. Maybe there are some clever algorithms that can, but we should probably look into something else.
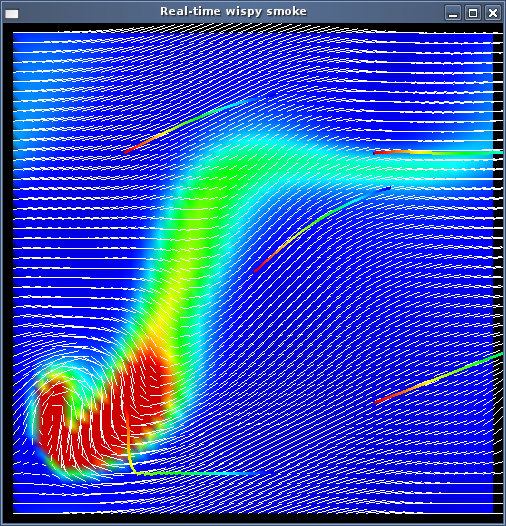
Combining all three techniques is pretty, but completely useless!
Coming up: Isolines. You know, the things you see on the weather map indicating areas with the same air pressure, well here it will be matter density, but the idea remains the same of course. They are much easier to evenly distribute them over the whole image, but are a bit harder to construct.
Update: People wanted to play with it already, so I made a fluids-0.0.0 release.
Webmentions
Heb je een reactie op dit artikel geschreven? Stuur me een webmention! Het kan een paar dagen duren voordat je reactie hier verschijnt.